
Admin Dashboard Introduction
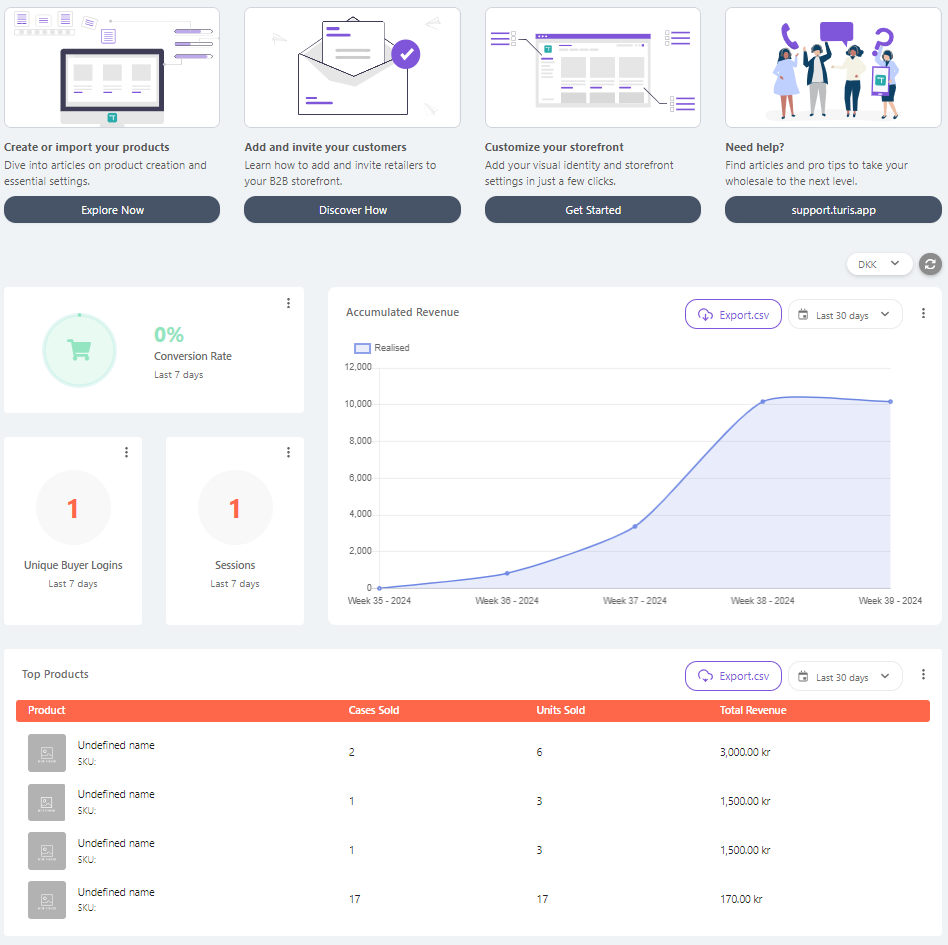
The admin dashboard provides a quick and intuitive overview of your B2B platform’s performance, along with easy access to our Help Center.
Getting Started
At the top of the dashboard, you’ll find helpful videos designed to guide you through the process of creating your first products, retailers, and buyers. Additionally, you’ll see a direct link to our Help Center for further assistance.

Key Metrics
Moving down, you’ll see a range of essential performance data, including Conversion Rates, Unique Buyer Log-ins, Sessions, and Accumulated Revenue:
Conversion Rates: This metric shows the percentage of log-ins that resulted in an actual order.
Unique Buyer Log-ins: This indicates the number of distinct buyers who have logged into your storefront. If a buyer logs in multiple times, only their first login is counted.
Sessions: This represents the total number of log-ins (or sessions) on your storefront.
Accumulated Revenue: This dataset displays the total revenue across all currencies. You can also choose to view the revenue in your preferred currency. Furthermore, this data can be exported as a .csv file for a simplified overview.

For all these datasets, you can customize the timeframe of the data displayed. To adjust the timeframe, use the three vertical dots menu if it’s not shown by default.

Top Products
At the bottom of the dashboard, you’ll find the Top Products section.
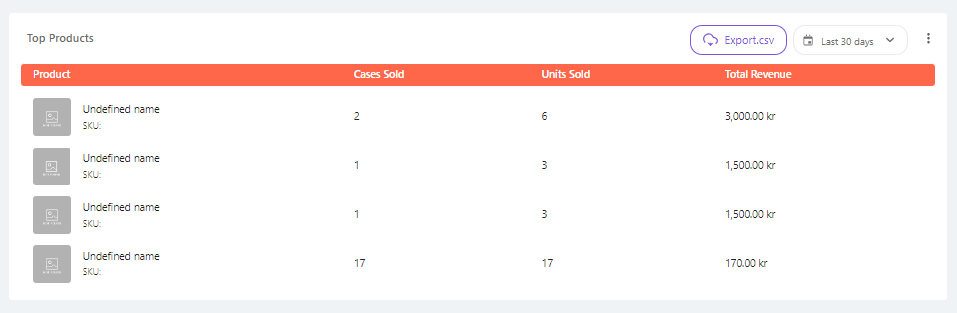
This dataset highlights key performance insights on your best-selling products, including:
- Cases sold
- Units sold
- Total revenue
You can customize the timeframe and the number of products displayed by default using the three vertical dots menu. Additionally, the Top Products dataset can be exported as a .csv file, allowing you to analyze the performance of the selected products within the chosen timeframe.

With these insights, the admin dashboard helps you track your platform’s success and optimize your B2B sales strategy efficiently.